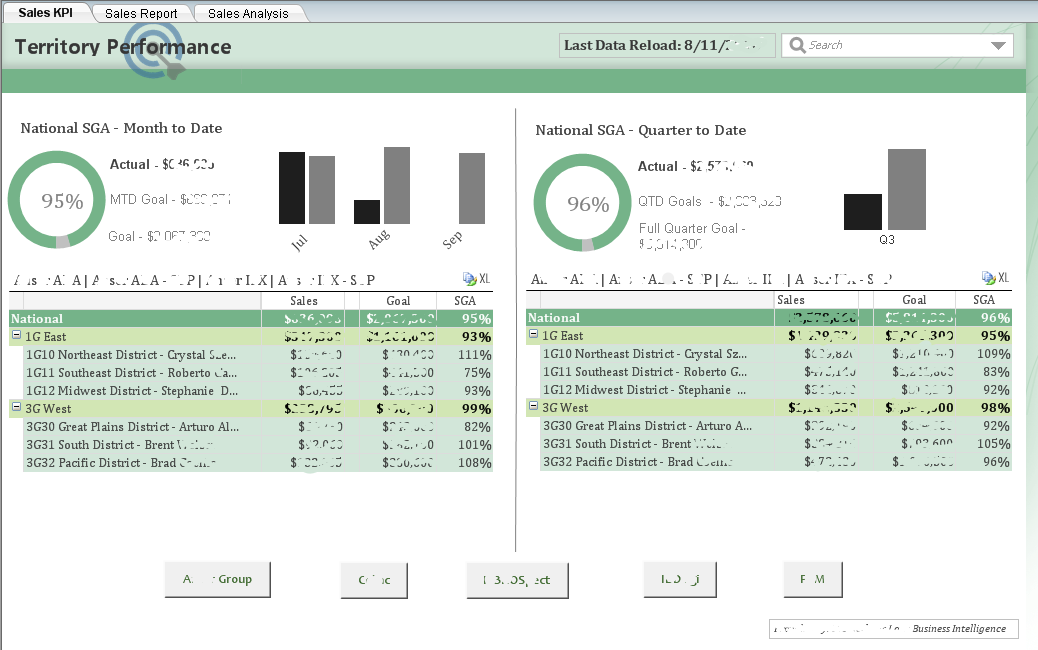
KPI's without context are just pretty graphics, as seen above. Don't become a victim of meaningless metrics.
Dashboards
Business intelligence dashboards are information management tools that are used to track organizational KPIs, metrics, and other data points relevant to the business. Through the use of visualizations, dashboards simplify complex data sets to provide users with at a glance awareness of current performance and/or future predictions.
Below we share a few redacted QlikView dashboards developed for a commercial organization and another for multiple organizations within a life science company.
This “Sales KPI” dashboard was created for the VP of Sales and the national managers of the sales organization. The VP always wanted to easily see the facts and, in this case, it was how their sales team was performing in relation to the goals that were set. We can see the month to data actuals, month to date goal, and the actual goal. Alongside those KPI’s are the same metrics at the quarter to date. Under the KPI is a high-level report on the national managers’ regions. It includes actuals, goals, and sales goal attained. This dashboard also allows the customers to drill down into the data for a grainier view.
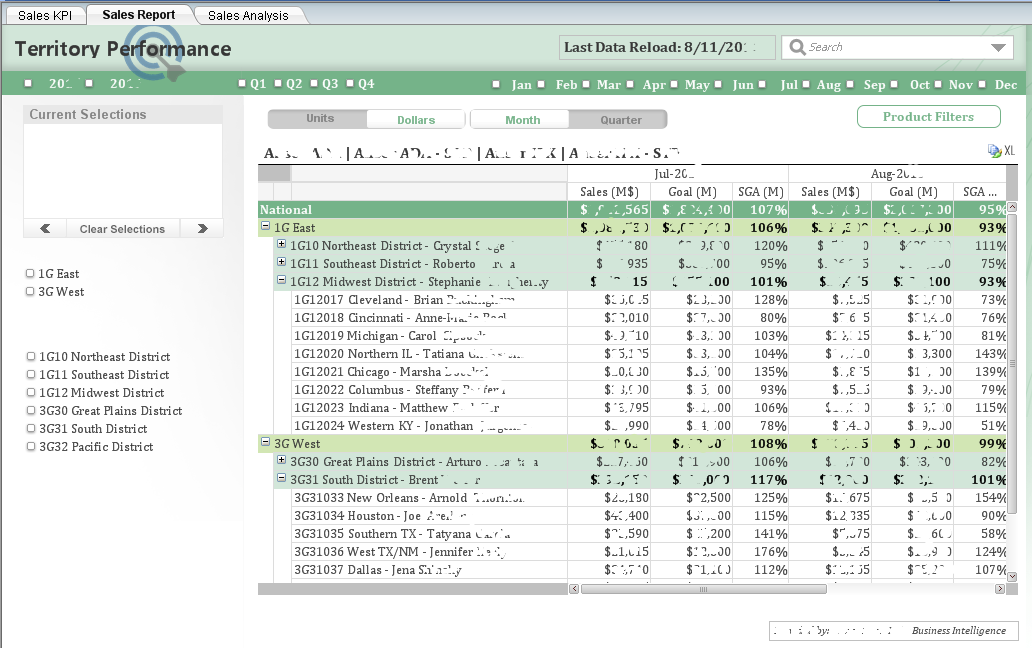
The “Sales Report” has much of the same information as the “Sales KPI” dashboard. However, the customers of this dashboard are the national managers. It lacks the KPI’s, however, it was designed to give them a view or the regional sales teams and how they were performing against their set goals. Notice that there are more filtering capabilities and also the options to view the goals in terms of “dollars” or “units”.
Self-service dashboards can be very powerful for enabling your customers to not only create their own visualizations, but also the ability to explore the data on demand.
Have you ever been in a meeting and a colleague comes up with an idea or has a question that can be explored/answered using the data? Well, with self-service dashboards, you can do exactly that within minutes without leaving the meeting.
Self-service reports are so much more than what we are presenting here. The BI tool at the company was QlikView. Had we been able to use Qlik Sense or a similar tool that would allow the BI team to create the framework, the users would have been able to create their own visualizations using that framework.
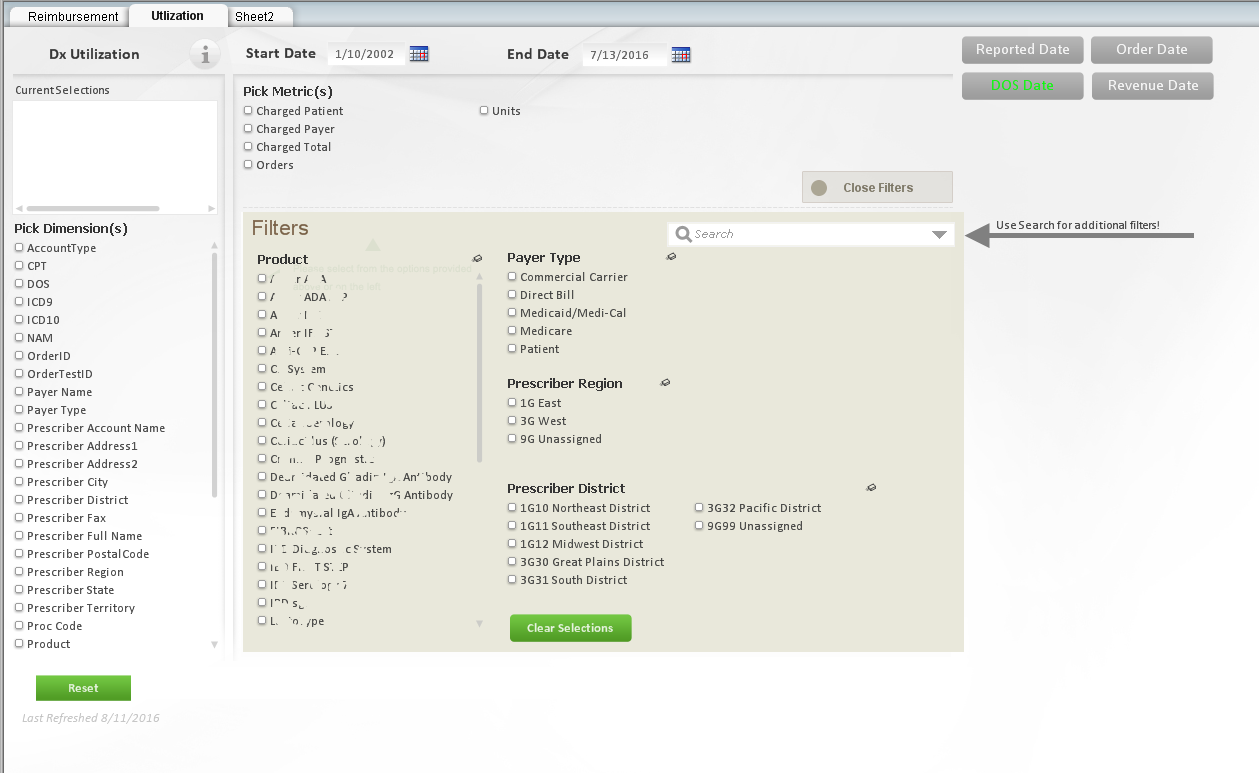
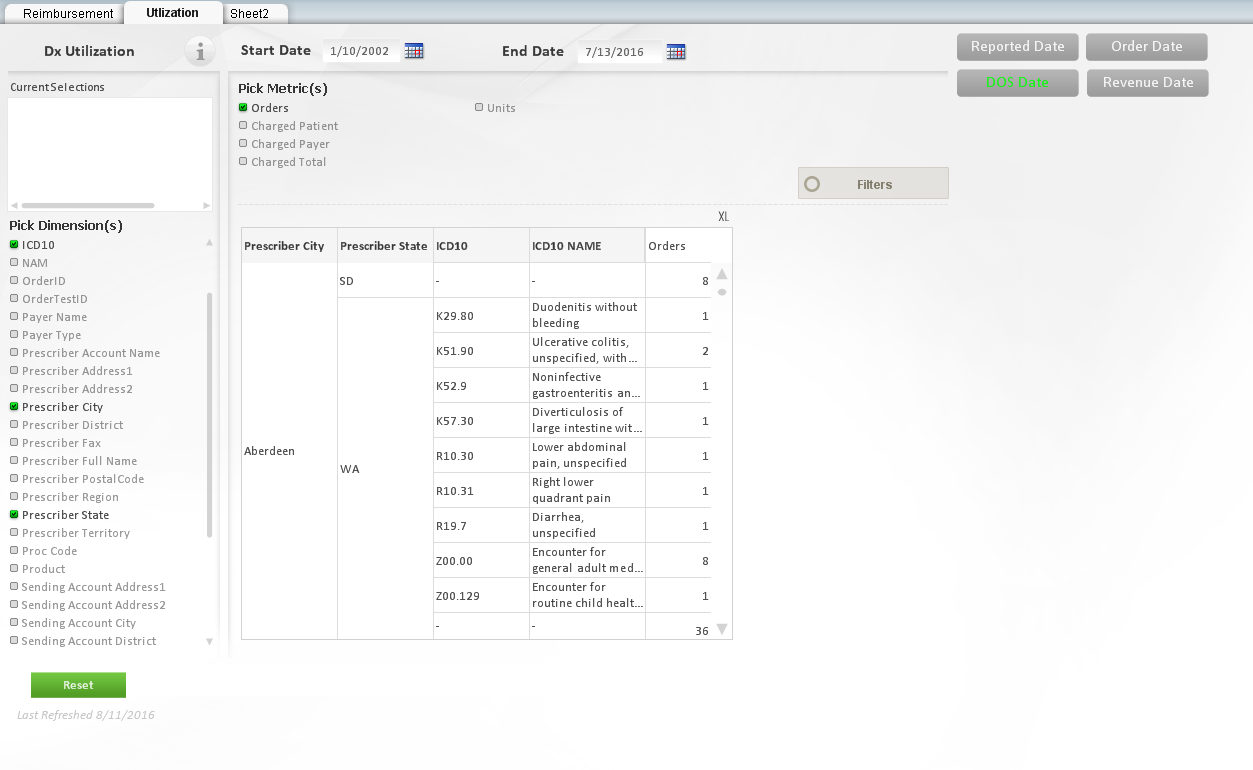
The next two dashboards give an example of meeting our customers’ needs using the tools available. These examples were “winners” because they eliminated 90% of ad hoc requests being made to the BI team. Once the customer picks the dimensions and metrics, they can export the data to excel and create their own visualizations. Note, the four dates to the right of the dashboard. In our use case development, we found that between the organizations making the ad hoc request, they each used the reporting date differently. For example, the finance team wanted to look at the data based off the “revenue recognition” data and the reimbursement team wanted to look at the data based on the “DOS”, also known as the “Date of Service”.